Composing a dashboard
A dashboard answers “how are we doing, and what needs me” in that order: figures first, then how they move and divide, then what to act on. Lintel’s Today dashboard is the worked example.
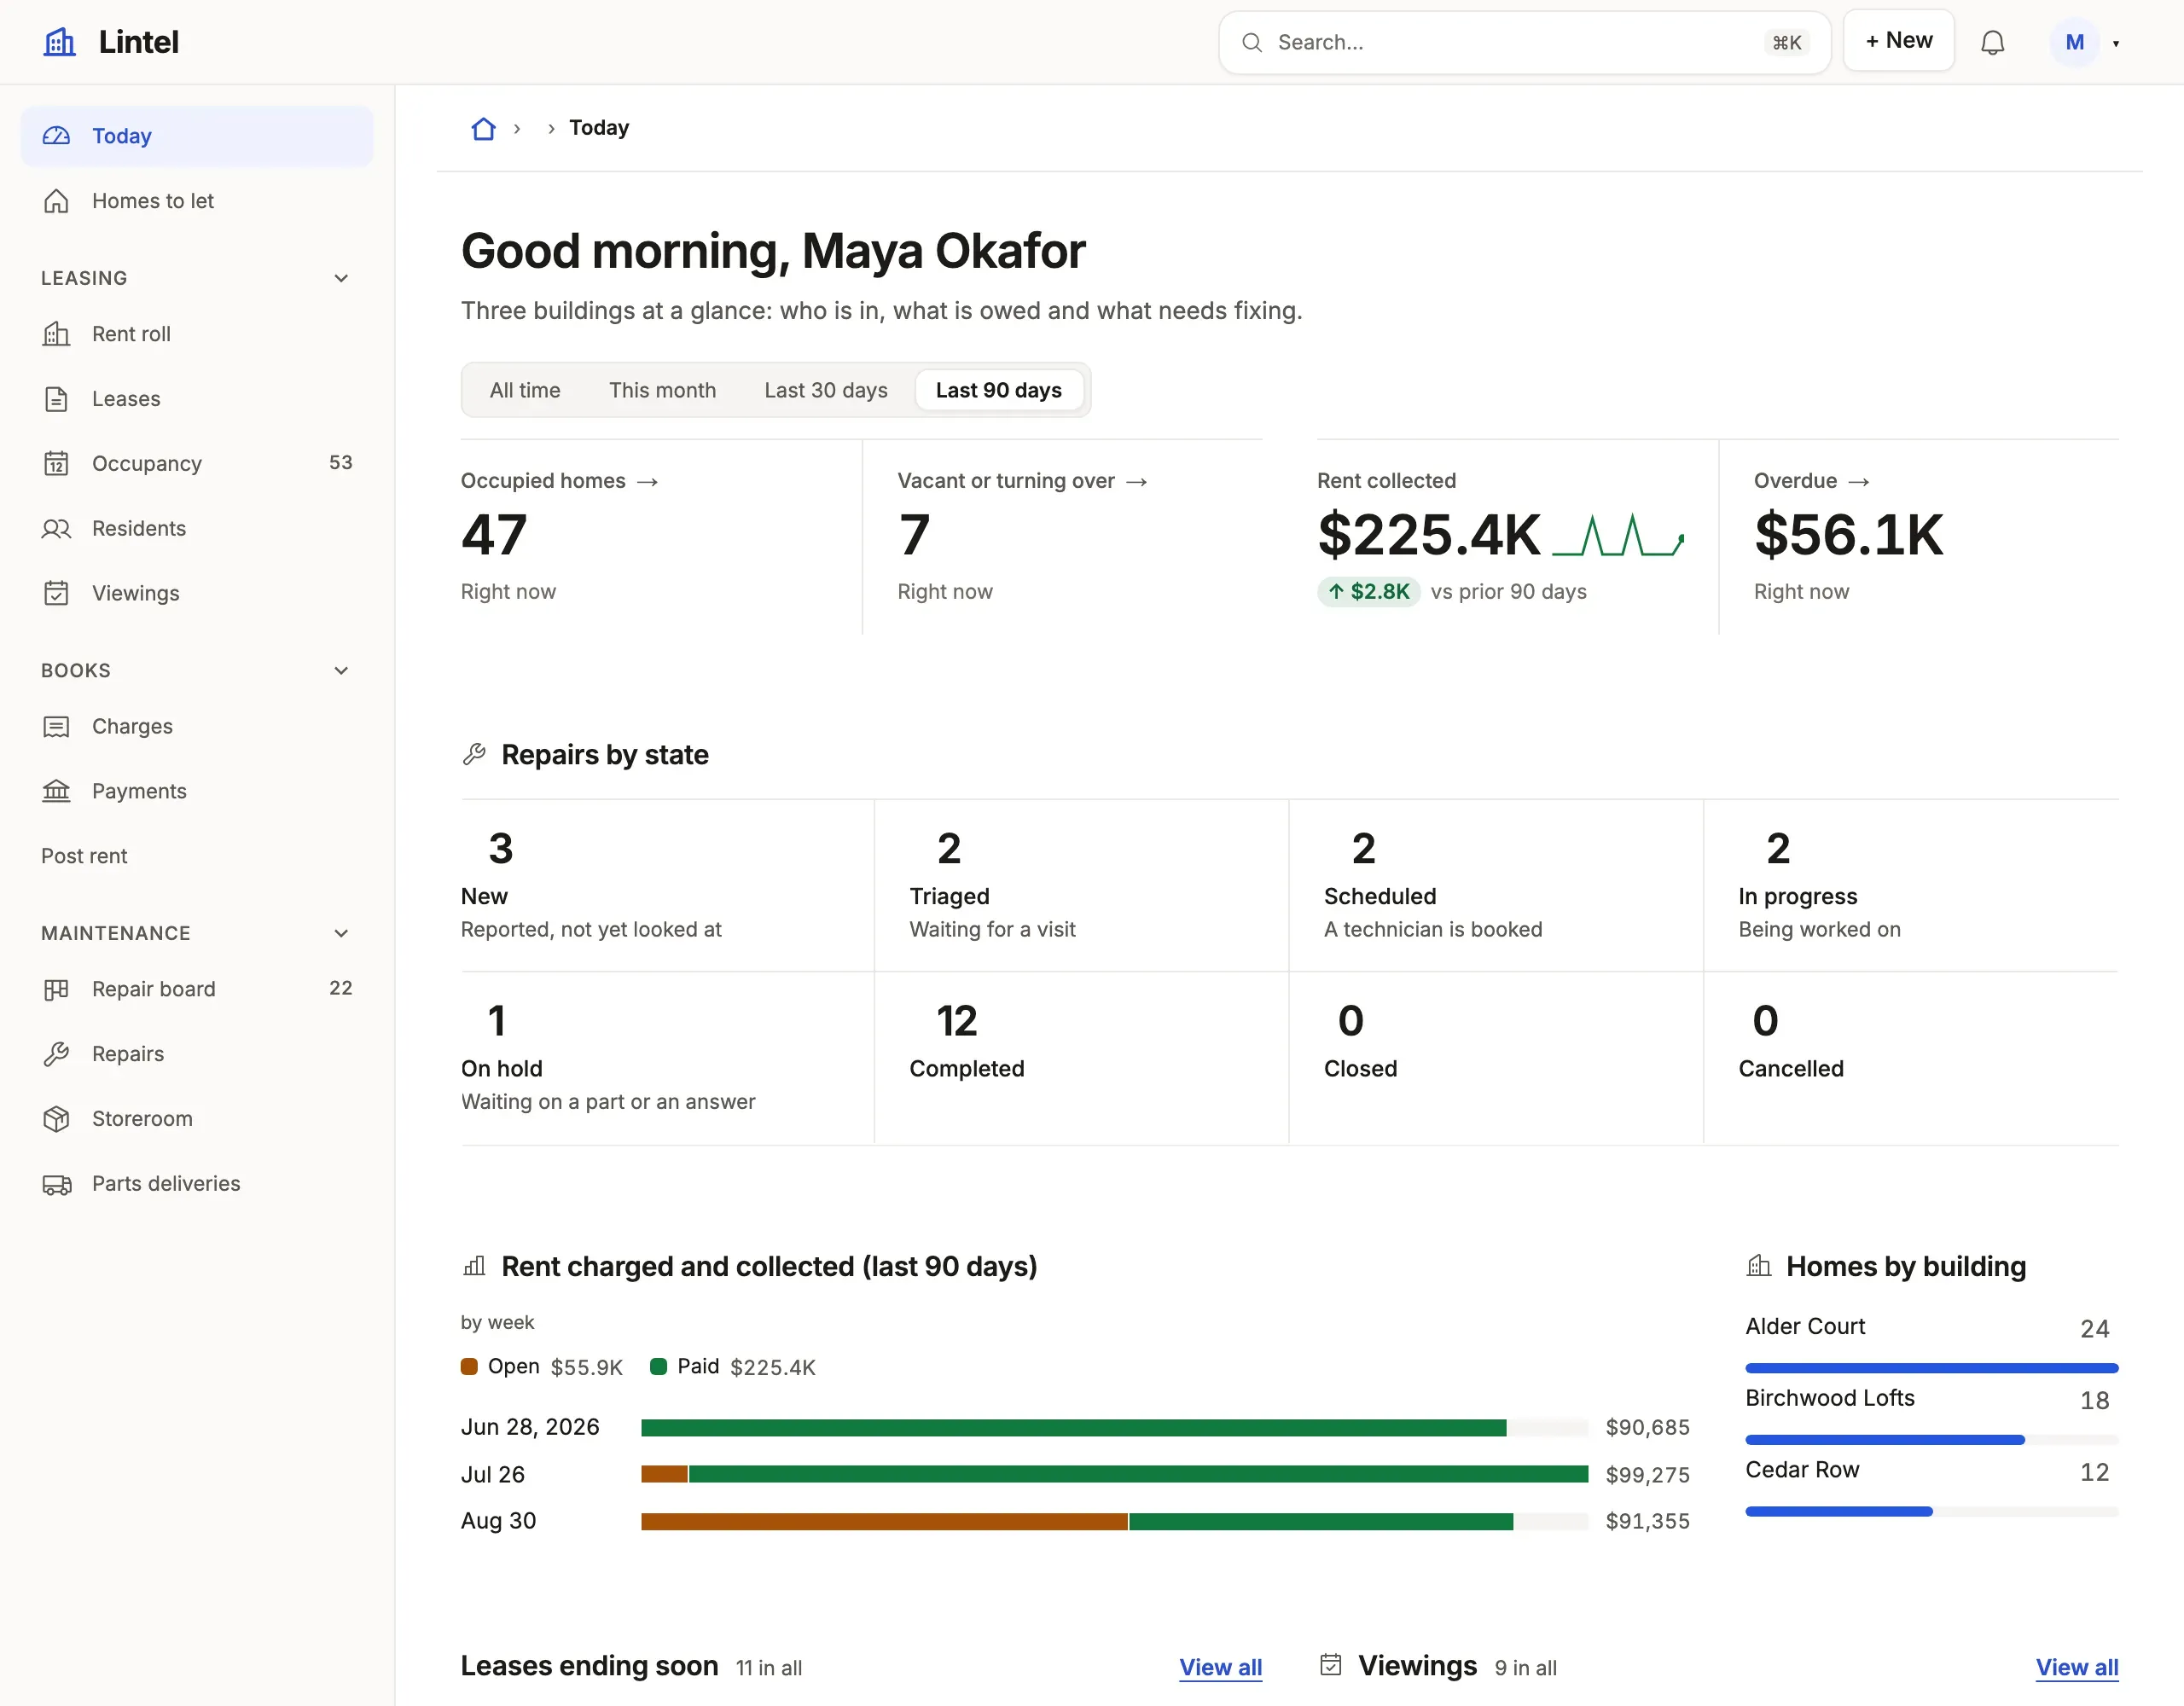
- Always, lead with a strip of three or four
metrics of equalwidth; a strip that does not divide leaves one card alone on a row —examples/apps/lintel/dashboards.ts:11. - When a figure has a before,
over(its date column) withbetter: the change from the period before and the trend across the window come unasked —examples/apps/lintel/dashboards.ts:17. - When the board is read by period,
windowson the dashboard andoveron each section they narrow —examples/apps/lintel/dashboards.ts:73. - When a figure moves over time, a
chartoverauto, which picks the day, week, month or quarter the window calls for —examples/apps/lintel/dashboards.ts:40. - When a total divides by a vocabulary, a
breakdownat a third or half width, beside a donut of another division —examples/apps/lintel/dashboards.ts:49. - When two divisions cross, a
matrix. - When there is work waiting,
rowsof it with alimit, two to a row —examples/apps/lintel/dashboards.ts:50. - When a number needs a sentence, a
notelast.
The sections are in Dashboards.